
- Knowledge Base
- Product Help and Guides
- Consultation Manager
-
Latest News
- April 2024
- March 2024
- February 2024
- January 2024
- December 2023
- September 2023
- August 2023
- June 2023
- May 2023
- April 2023
- March 2023
- February 2023
- December 2022
- November 2022
- October 2022
- September 2022
- August 2022
- July 2022
- May 2022
- April 2022
- March 2022
- February 2022
- January 2022
- December 2021
- November 2021
- October 2021
- September 2021
- August 2021
- July 2021
- June 2021
- May 2021
- April 2021
- March 2021
- February 2021
- January 2021
- December 2020
- November 2020
- October 2020
- September 2020
- August 2020
- July 2020
- June 2020
- May 2020
- April 2020
- March 2020
- February 2020
- January 2020
- December 2019
- November 2019
- October 2019
- September 2019
- August 2019
- July 2019
- June 2019
- May 2019
- April 2019
- February 2019
- January 2019
- November 2018
- June 2018
- January 2018
- November 2017
-
Product Help and Guides
- Coronavirus Help Centre
- Vision 3 Release Guides
- Consultation Manager
- Vision +
- SIS Vision+ Release Guides
- Registration
- Patient Services - England, Scotland and Northern Ireland
- My Health Online (MHOL) - Wales only
- Vision 3 Appointments
- Daybook
- Search and Reports
- Clinical Audit
- Mail Manager
- Management Tools
- Registration Links
- GP Communicator
- Utilities
- Outcomes Manager
- Vision Anywhere
- Vision Anywhere - Release Guides
- Appointments
- Appointments Setup
- Appointments Reporting
- Tasks
- Vision360 Releases
- Shared Care
- Community
- General Hints and Tips
- Scotland Only
- EMIS vs Cegedim - Key Comparisons
- England Only
- Wales Only
- Northern Ireland Only
- SNOMED CT Releases and Guides
- Medication Dictionary Releases
- Partner Solutions
- Seasonal Influenza Help Centre
- Patient Groups
- Flash Cards - Short Printable 'How do I..? Guides
- Known Issues
- Desk Aids
-
Webinars and Events
-
Training and Support
-
Downloads
-
vStore and Partners
Did you know you can graph specific information in a patient's record in Consultation Manager?
Any numeric data in Consultation Manager can be viewed as a graph.
Graphs are especially useful for viewing numerical data and for demonstrating trends to patients. But did you know that if you have a lot of data on a chart, you can expand a particular area of the graph you are interested in viewing?
- Right click on a data line, for example, weight and select Graph. The graph displays:
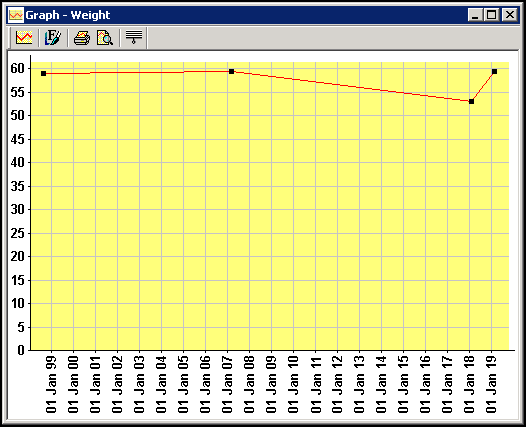
- To expand the area you are interested in, position the cursor to the left and above the area, hold down the left mouse click and drag the resulting square around the result. Let the mouse click go and the area expands.
- To revert to displaying all data, select Fit to Graph
 .
.
Training Tip - For more information on graphs, see Displaying Data as a Graph in the Consultation Manager Help Centre for further details.